
In November 2014, the total retail sales of consumer goods reached RMB2,347.5 billion (US$381.7 billion), up by 11.7% year-on-year (nominal growth rate. The real growth rate was 11.2%). From January to November 2014, the total retail sales of consumer goods reached RMB23,659.3 billion, up by 12.0% year-on-year.
Of which, the online retail sales of units above designated size was RMB385.8 billion (US$62.7 billion), increased 55.9%.
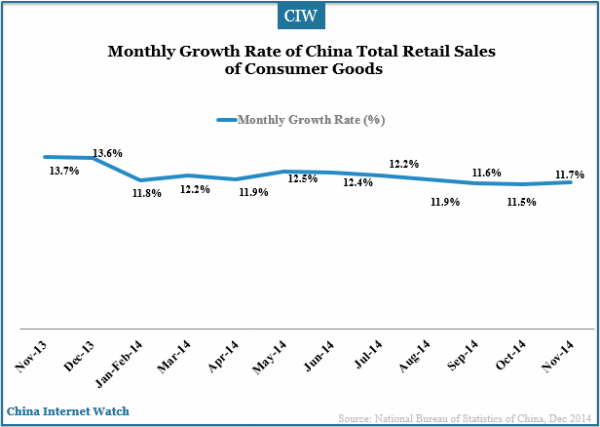
In terms of different areas, the retail sales of consumer goods in urban areas was 2,031.6 billion yuan in November, up by 11.6%, year-on-year; while that in rural areas was 315.9 billion yuan, up by 12.5%, year-on-year. From January to November, the retail sales of consumer goods in urban areas was 20,420.1 billion yuan, up by 11.8%, year-on-year; while that in rural areas was 3,239.1 billion yuan, up by 12.9%.
In terms of different consumption patterns, the catering services in November gained 254.1 billion yuan, up by 9.8%, year-on-year. The retail sales of goods gained 2,093.3 billion yuan, up by 12%. From January to November, the catering services gained 2,513.3 billion yuan, up by 9.7%, year-on-year; the retail sales of goods gained 21,146.0 billion yuan, up by 12.2%.
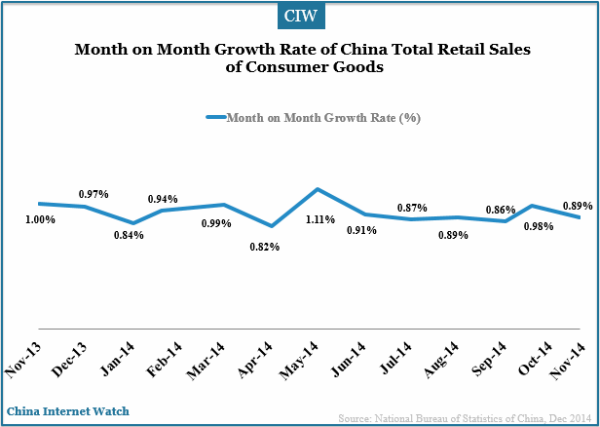
Month on Month Growth Rate:
Total Retail Sales of Consumer Goods in November:
| Item | November | Jan-Nov | ||
| Absolute Value | Y/Y | Absolute Value | Y/Y | |
| (100 million yuan) | (%) | (100 million yuan) | (%) | |
| Total Retail Sales of Consumer Goods | 23475 | 11.7 | 236593 | 12 |
| Of Which: Retail Sales of the Enterprises (units) above Designated Size | 11794 | 8.7 | 118451 | 9.3 |
| Grouped by Different Areas | ||||
| City | 20316 | 11.6 | 204201 | 11.8 |
| At and Below County Level | 3159 | 12.5 | 32391 | 12.9 |
| Grouped by Consumption Patterns | ||||
| Catering Services | 2541 | 9.8 | 25133 | 9.7 |
| Of which: Income of Catering Services of the Enterprises (units) above Designated Size | 740 | 2.4 | 7353 | 2.1 |
| Retail Sales of Goods | 20933 | 12 | 211460 | 12.2 |
| Of which: Income of Retail Sales of Goods of the Enterprises (units) above Designated Size | 11054 | 9.2 | 111097 | 9.8 |
| Of which: Grain, Oil, Foodstuff, Beverages, Tobacco and Liquor | 1523 | 13 | 15277 | 10.9 |
| Garments, Footwear, Hats, Knitwear | 1231 | 13.4 | 11087 | 10.9 |
| Cosmetics | 163 | 10.3 | 1640 | 10.3 |
| Gold, Silver and Jewelry | 232 | 11.5 | 2680 | -0.7 |
| Commodities | 395 | 15.2 | 3937 | 11.5 |
| Household Appliances and AV Equipment | 648 | 11.3 | 6787 | 8.7 |
| Traditional Chinese and Western Medicines | 599 | 13.9 | 6215 | 15 |
| Cultural and Office Appliances | 231 | 9.2 | 2275 | 11.2 |
| Furniture | 218 | 12.8 | 2013 | 14 |
| Communication Appliances | 300 | 57.2 | 2334 | 29.7 |
| Petroleum and Related Products | 1630 | 2.6 | 18185 | 7.2 |
| Automobile | 2835 | 2 | 29374 | 7.9 |
| Building and Decoration Materials | 282 | 15.5 | 2465 | 13.7 |
Also read: E-commerce to Account for 18% of China’s Total Retail Sales in 2018